Hands-on: Build your own Industrial IoT Demo
Even though there are various off-the-shelf Industrial IoT solutions on the market, developing your own solution from scratch can offer huge advantages in terms of flexibility, control, and cost-effectiveness. Also, it provides a deeper understanding of the complete architecture of Industrial IoT systems and their specific requirements. In this article, we will dive into the practical aspects and explore the process of creating our own Industrial IoT demo, covering every layer from the field level up to the visualization layer. I hope you will gain valuable insights into both the hardware and software setup, enabling you to build a customized stack using open-source solutions. Let’s embark on this hands-on journey to unleash the true potential of Industrial IoT.
Even though there are various off-the-shelf Industrial IoT solutions on the market, developing your own solution from scratch can offer huge advantages in terms of flexibility, control, and cost-effectiveness. Also, it provides a deeper understanding of the complete architecture of Industrial IoT systems and their specific requirements. In this article, we will dive into the practical aspects and explore the process of creating our own Industrial IoT demo, covering every layer from the field level up to the visualization layer. I hope you will gain valuable insights into both the hardware and software setup, enabling you to build a customized stack using open-source solutions. Let’s embark on this hands-on journey to unleash the true potential of Industrial IoT.
Use Case
As an assumption for this demonstration, we will concentrate on one particular use case: visualizing environmental data from a piece of machinery in our factory. The main objective is to track and assess how the environmental condition is affecting our manufacturing process. We will deploy a smart sensor that will directly gather environmental data from the machinery in real-time to achieve this. An edge gateway will then be used to send this data to our IoT Platform.
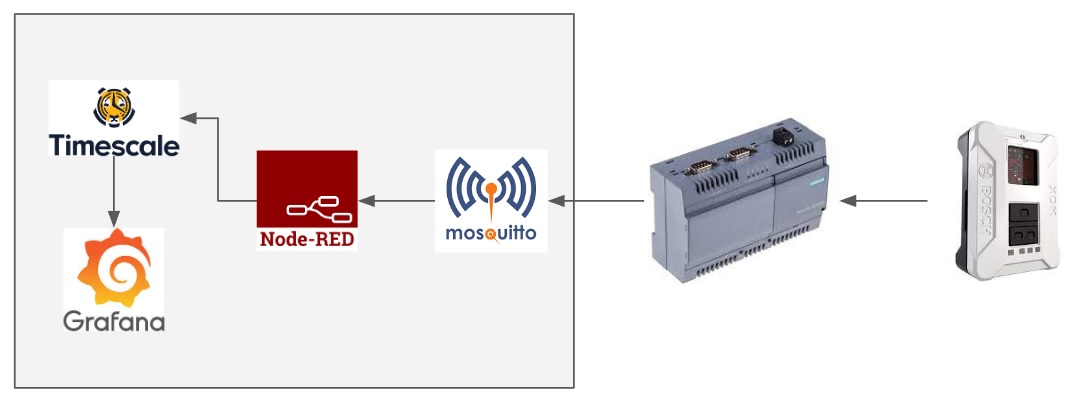
Solution Architecture
In our solution, we have designed the following solution architecture to efficiently collect, process, store, and visualize sensor data:
Smart Sensor and Edge Gateway Setup
To collect and transmit sensor data, we will employ Bosch XDK smart sensor. This device will gather the necessary data, which will be sent to the Edge Gateway using the MQTT protocol.
Data Pre-processing and IoT Platform Integration
To optimize the raw sensor data, we will leverage the power of Node-RED for efficient data pre-processing on the Edge Gateway. Node-RED will handle data formatting and prepare it for further analysis. After pre-processing, the data will be transmitted to the IoT Platform via MQTT.
Data Storage and Visualization
For secure and organized storage of the processed data, we will utilize TimescaleDB. Node-RED will write the transformed data into the database, facilitating easy retrieval and analysis.
To visualize and gain insights from the collected data, we will implement Grafana. Grafana will connect to TimescaleDB, enabling us to fetch the required data and generate visually appealing dashboards. These dashboards will provide valuable insights into the environmental impact on our manufacturing process, aiding in data-driven decision-making.
Unified Namespace
It’s also worth mentioning that we will utilize the Unified Namespace, term coined by Walker Reynolds (4.0 Solutions), for our MQTT topic structure to ensure a standardized and organized approach to data management and retrieval in our Industrial IoT solution. Here are a few reasons why we opt for a unified namespace:
- Consistency: By using a consistent namespace format, we establish a uniform structure for identifying and locating sensor data. This consistency makes it easier to understand and manage the data across different components of the solution.
- Scalability: As the solution expands with additional sensors or equipment, a unified namespace allows for seamless integration of new devices. The namespace can accommodate multiple sensors within the same environment or across different locations, ensuring scalability without sacrificing organization.
- Hierarchy and Context: The namespace structure, “raw/Acme/Milling/CNC_01/env_sensor” as an example for our demo, provides a hierarchical representation of the data. It includes relevant information about the site (Acme), the specific site area (Milling), the equipment (CNC_01), and the sensor type (env_sensor). This hierarchy adds contextual information to the data, making it easier to locate and understand.
- Searchability and Filtering: A well-defined namespace enables efficient data search and filtering. With a unified structure, it becomes simpler to query and extract specific subsets of data based on criteria such as equipment type, location, or sensor category. This enhances data retrieval and analysis capabilities.
- Ease of Maintenance: With a standardized namespace, managing and maintaining the data becomes more streamlined. It simplifies tasks such as data organization, data migration, and system updates, as all components follow a consistent naming convention.
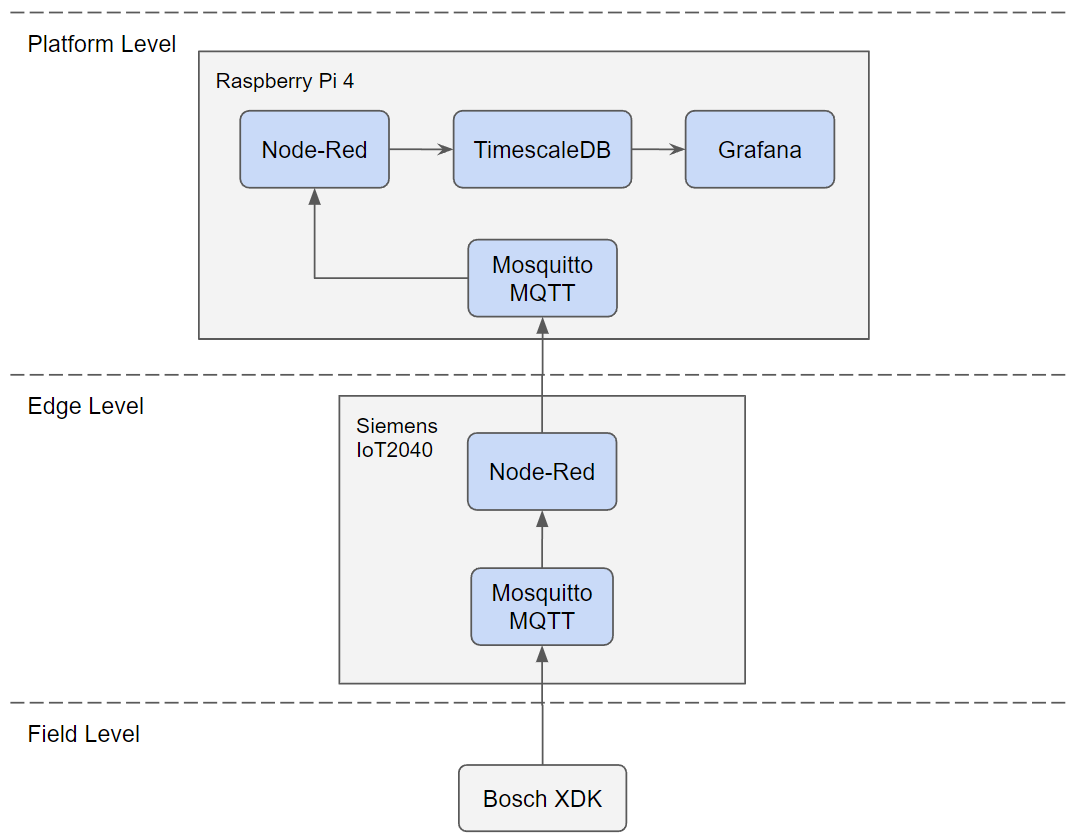
Requirements
For the successful implementation of this demo, we will require specific hardware and software components. Here is a breakdown of the essential items:
Required Hardware:
- Sensor: Bosch XDK
- Edge Gateway: Siemens IOT2040
- Platform Server: Raspberry Pi 4
Required Software:
- Containerization: Docker
- MQTT Broker: Mosquitto
- Business Logic: Node-Red
- Database: TimescaleDB
- Visualization: Grafana
Hardware Setup
Siemens IoT2040 as an Edge Gateway
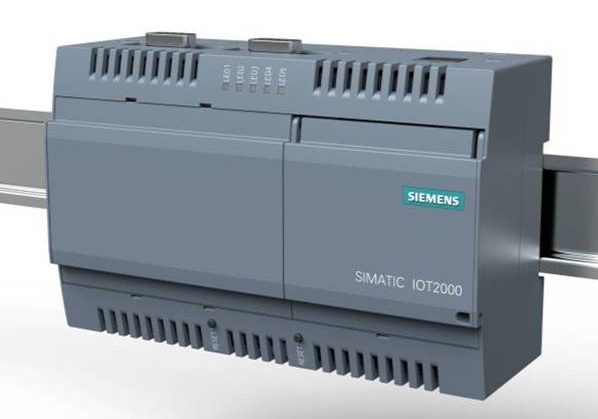
Siemens IoT2040 is an industrial-grade edge gateway that can be used to collect sensor data from field and send it to the cloud. Apart from IoT2040 device, you can use any Linux based edge device to implement our solution. The following steps are needed to configure the IoT2040:
- Start by burning the example image onto an SD card. Connect the SD card to the Siemens IoT2040 device. For detailed instructions on setting up the IoT2040, refer to this post.
- The example image comes with pre-installed Node-Red and Mosquitto MQTT broker, eliminating the need for extensive software setup.
- Once the device is successfully connected to your network, take note of the assigned IP address. You will require this information for the subsequent sensor device configuration.
Bosch XDK as a Field Sensor
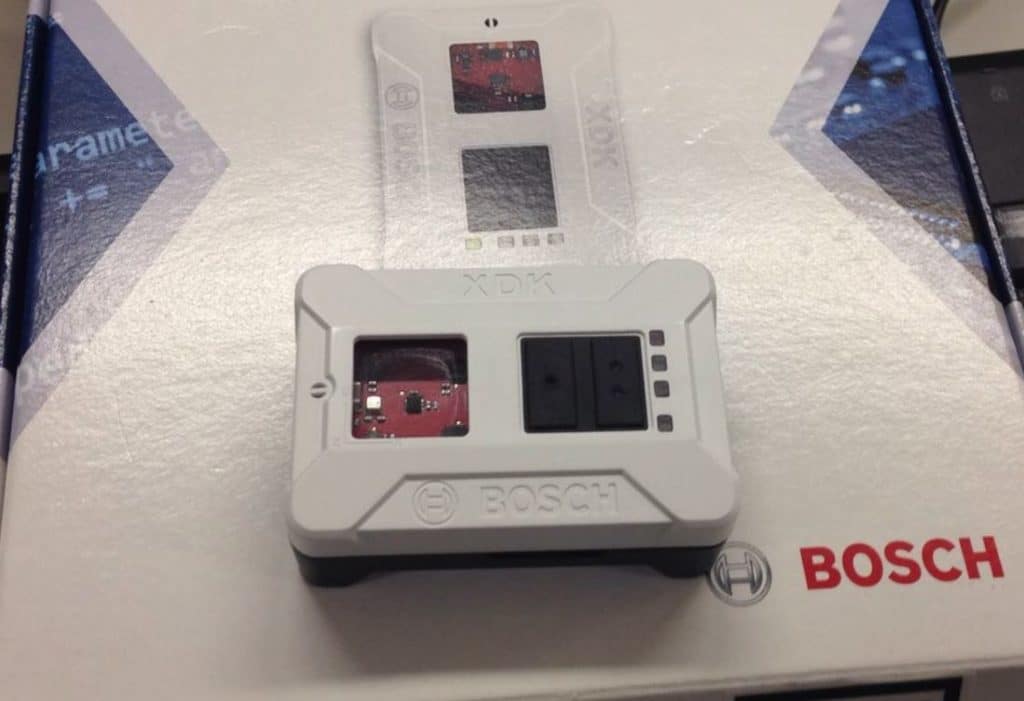
Bosch XDK is a programmable IoT sensor that is equipped with a full range of MEMS (micro-electromechanical system) sensors such as Accelerometer, Magnetometer, Gyroscope, Humidity/Temperature/Pressure Sensor, Acoustic Noise Sensor, Digital Light Sensor. XDK has its own workbench to program it in C or in more high level language Eclipse Mita
The following steps are needed to configure the XDK sensor:
- Install the Bosch XDK Workbench software on your computer. You can download it from the official website
- Workbench has already example projects that you can utilize for your needs. This is my version to send environmental data over MQTT in Github. Download and import the project to Workbench. You only need to update “source/AppController.h” file for WLAN, SNTP and MQTT configuration
- WLAN and SNTP configurations will depend on your specific setup, set them accordingly. The MQTT broker address should be set to http://”iot2040_ip_address”:1883, and the MQTT topic should be set as “raw/Acme/Milling/CNC_01/env_sensor”.
- Ensure that the XDK device is connected and visible in the Workbench. Once you have finished configuring the settings, click the “Flash” button located in the top left panel. This will build the project and then flash the program onto the XDK device.
- Once the flashing process is complete, your XDK device is ready to transmit environmental data to the MQTT broker specified in the configuration.
Raspberry Pi 4 as an IoT Platform
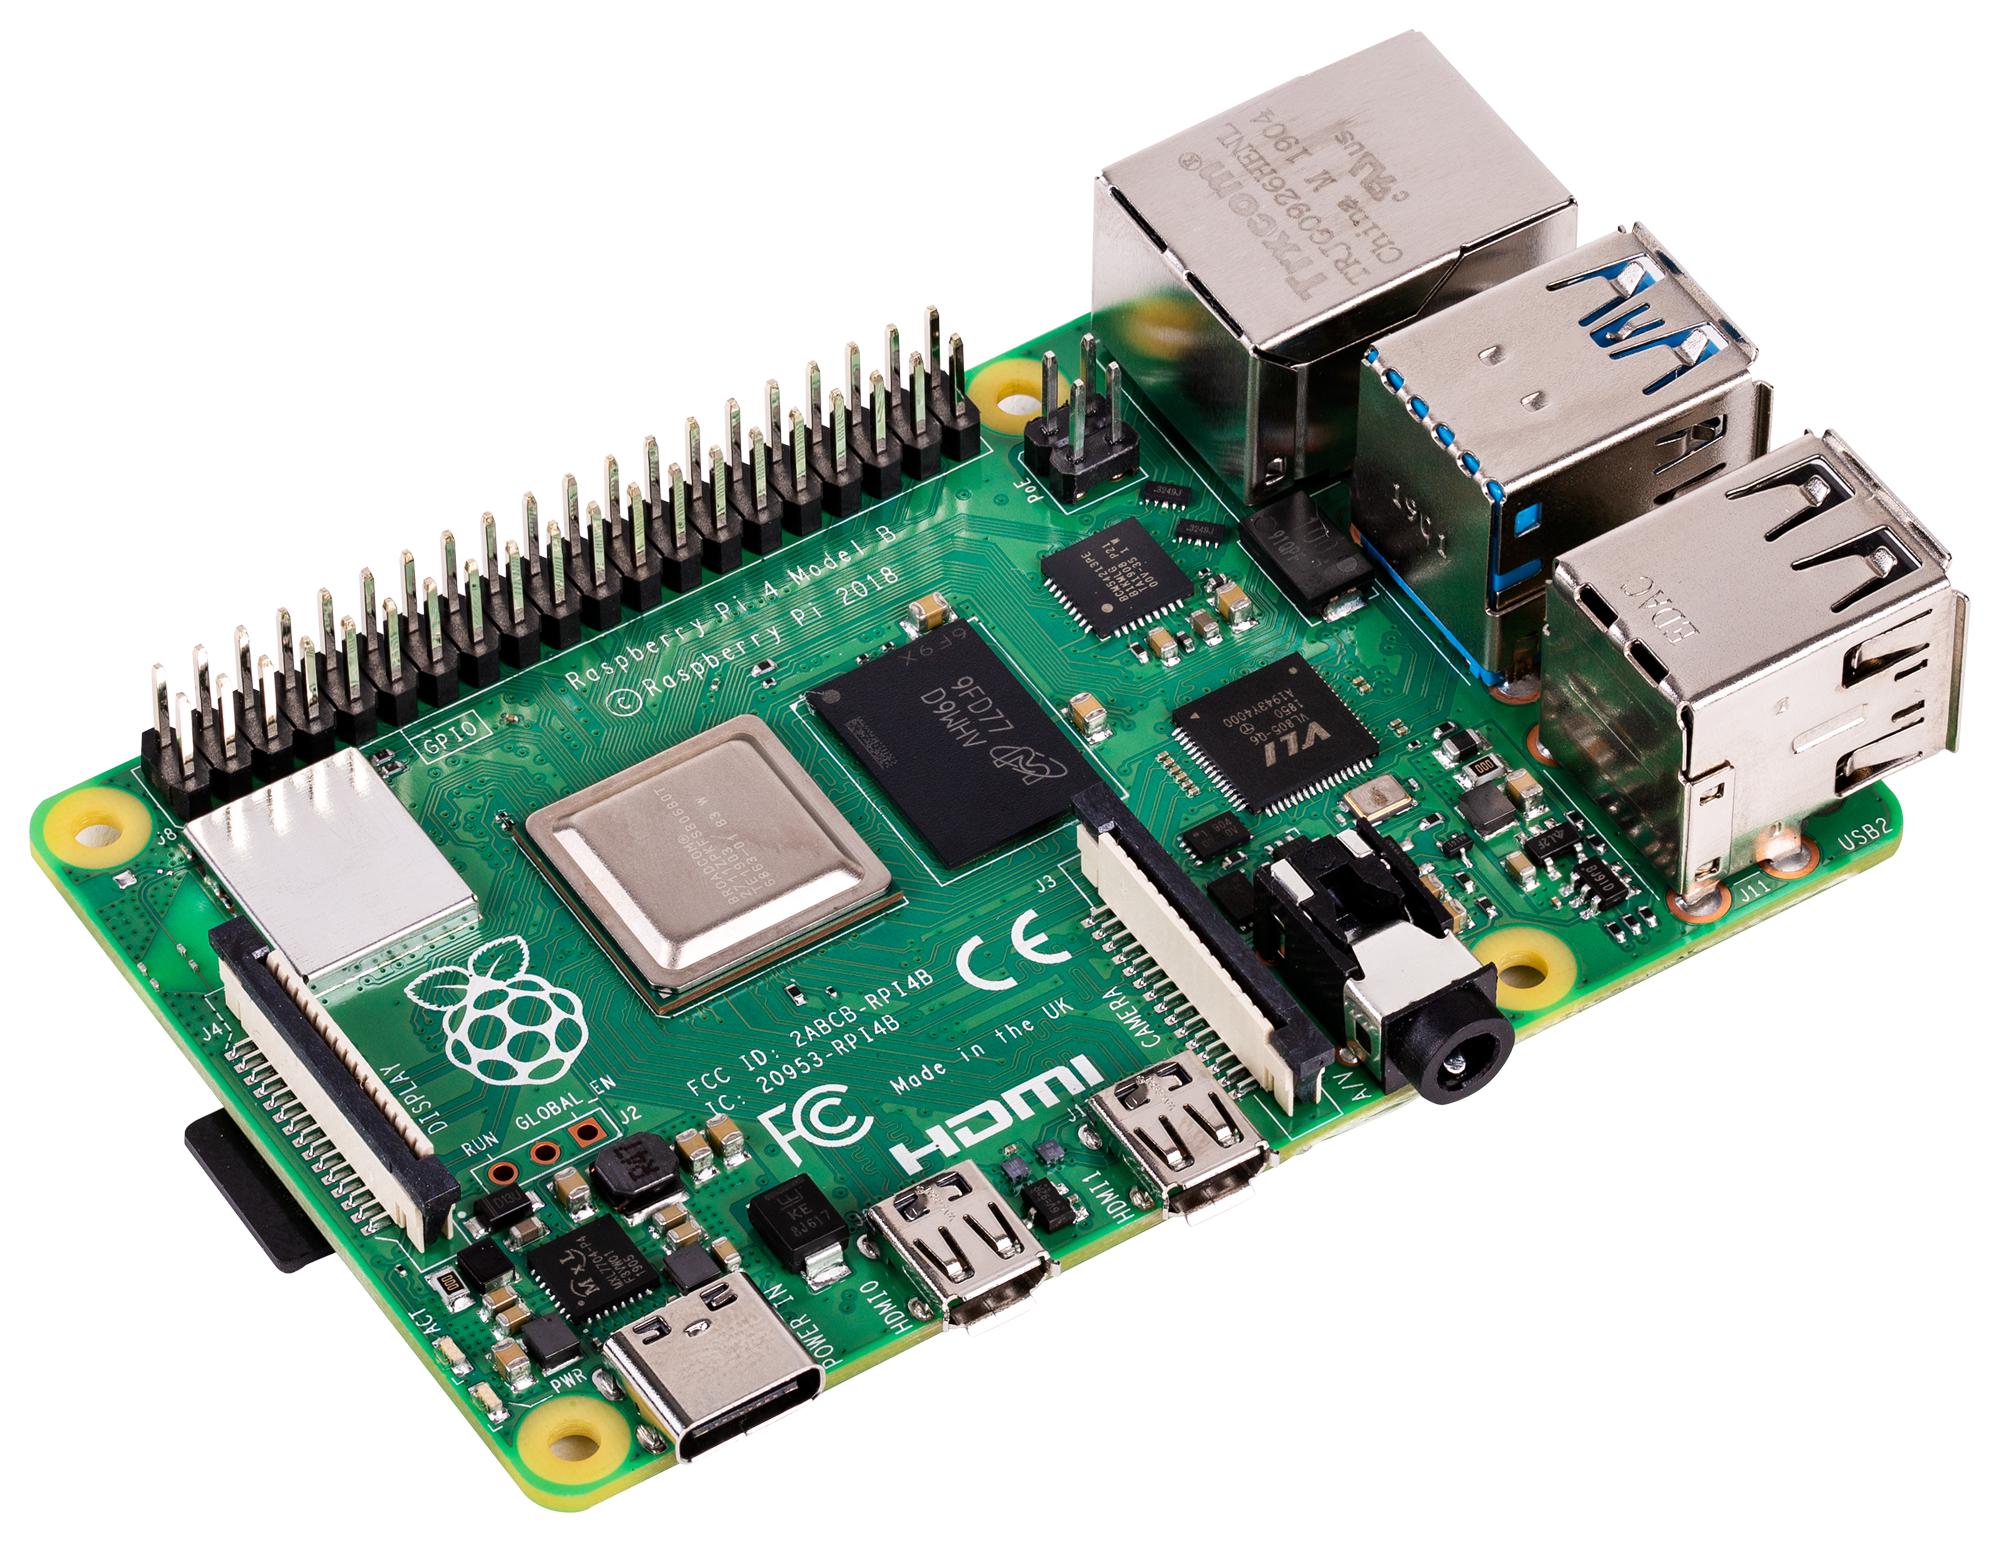
To implement our IoT platform, we have chosen the Raspberry Pi 4. While it is feasible to implement our software components on any Linux devices or servers, we specifically opted for the Raspberry Pi to highlight the possibility of utilizing modest, compact devices. Follow these step-by-step instructions for the hardware setup:
- Install the Raspbian operating system on the Raspberry Pi. You can use the Raspberry Pi Imager tool to conveniently download and burn the relevant Raspbian image onto an SD card.
- Next, install Docker on the Raspberry Pi by following the instructions provided here.
- After installing Docker, proceed to install Docker Compose on the Raspberry Pi by following the steps outlined here.
Software Setup
Mosquitto MQTT Broker on IoT2040
Mosquitto is ready to use in IoT2040 image as we mentioned before. If you are facing any issue with Mosquitto, check /etc/mosquitto/mosquitto.conf file and make sure it’s configured as below:
listener 1883
allow_anonymous true
Node-Red on IoT2040
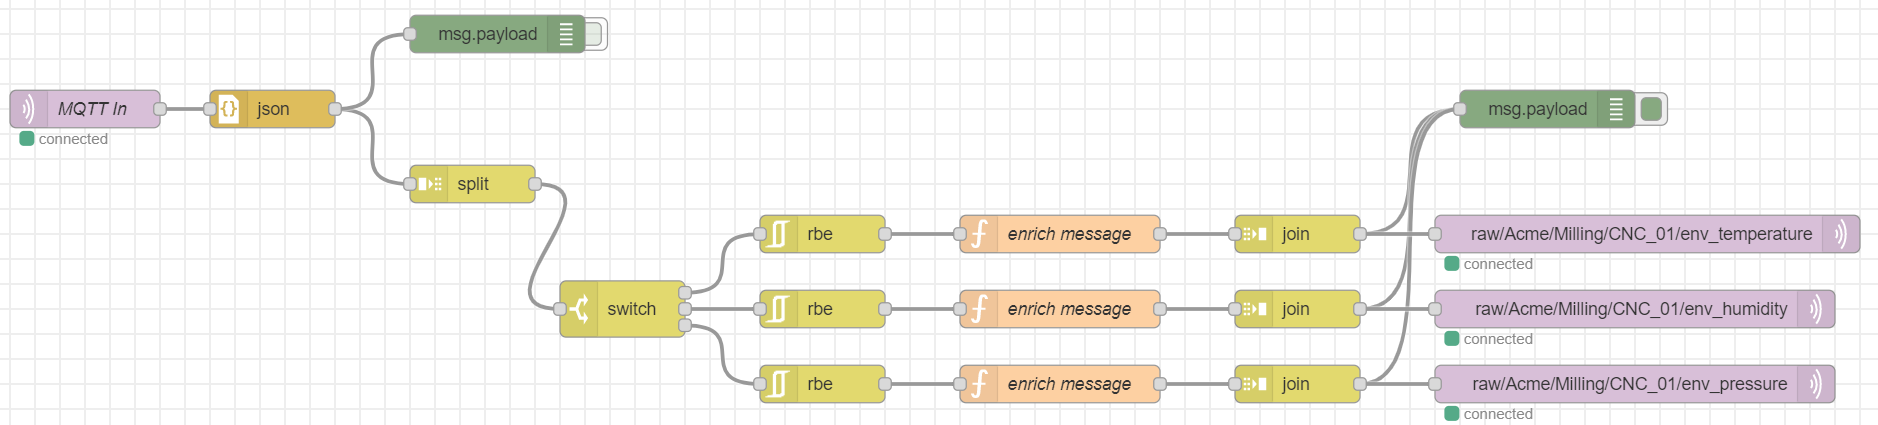
Node-Red is also ready to use in IoT2040 image. We’ll start to build our own flow to collect XDK sensor data and several actions should be performed on ingested data before sending it to IoT Platform so let’s do it step by step:
- Node-Red instance is available at http://”iot2040_ip_address”:1880
- “MQTT In” node is needed to ingest XDK data. Add it to the flow and configure new MQTT broker as http://”iot2040_ip_address”:1883 and MQTT Topic as “raw/Acme/Milling/CNC_01/env_sensor”
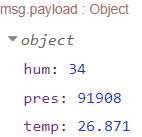
Example Payload - When we check the incoming data, we’ll see raw temperature, humidity and pressure values in one message. As a first step we need to split those messages and send them separately. In order to do that, add “Split” node. “Object split” will be used in our case since we want to send each key/pair in individual message. Click “Copy key to” box and set the field as “msg.sensor” so our keys will be saved under msg.sensor.
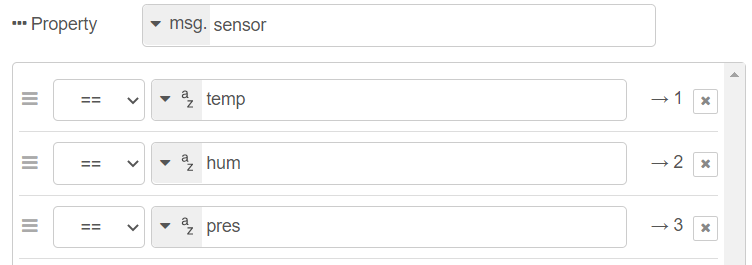
- Now we split our messages but they are still going through same route. In order to differentiate the route of individual messages, we’ll use “Switch” node. Add Switch node to the flow and connect Split and Switch nodes. Set property field as “msg.sensor” and add three different route as below.
Split Node Configuration - Before starting pre-processing, we want to eliminate unnecessary load for IoT Platform so we only want to send the sensor value if it’s changed, it’s called report by exception. We have “rbe” node exactly for this job so we’ll add it into our flow and set the property as “msg.payload”. This node will check if new value is different from previous one and if yes, it’ll send it to next node. If not, message will be discarded.
- Now we have separate messages in their own route so we can start to pre-process the messages. Here’s our list of task to perform: 1) Add timestamp for each message, 2) Reduce temperature decimal precision to 1, 3) Convert pressure unit to Pa to kPa and reduce decimal precision to 2. We’ll add three different “function” node to perform these tasks and add related codes to the individual nodes as below:
 // Temperature
 msg.payload = {
     "time": new Date(),
     "measurement": parseFloat(msg.payload.toFixed(1)),
 }
 return msg;
// Humidity msg.payload = { "time": new Date(), "measurement": msg.payload, } return ms// Pressure msg.payload = { "time": new Date(), "measurement": parseFloat((msg.payload/1000).toFixed(2)), } return msg; - As a last step, we want to combine multiple messages in one message before sending them to IoT platform in order to reduce message traffic. In our case XDK sends data every second but we’ll wait for 10 seconds and combine all the messages in one message and then release it. Add “Join” node into our flow and use below configuration:
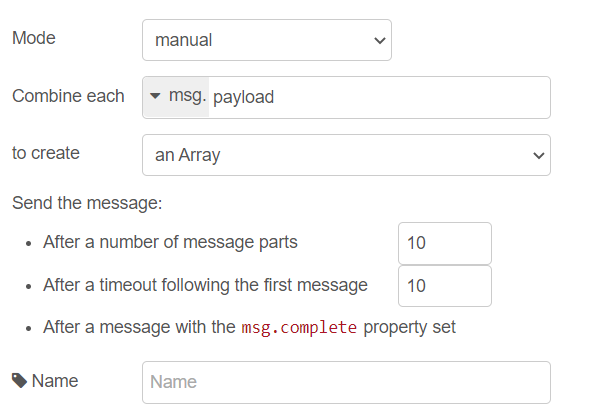
Join Node Configuration - Finally our message is ready to be sent via MQTT. Add “MQTT out” node and configure Server: http://”raspberrypi_ip_address”:1883 Topic: raw/Acme/Milling/CNC_01/env_temperature
- Don’t forget to deploy flow by clicking “Deploy” button on top-right corner.
Final flow should look like this:
Docker on Raspberry Pi
We’ll use containerization to manage our different services in our IoT Platform.
- Create a folder for our project named “iotdemo” and put below docker-compose.yml file in it. Check your user id with “id -u” command if it’s different than “1000”, change user configuration in docker-compose file accordingly. Replace username and password fields as well.
version: '3.3' services: grafana: image: grafana/grafana:latest user: "1000" container_name: grafana restart: unless-stopped ports: - "3000:3000" environment: - GF_SECURITY_ADMIN_USER=<your_username_here> - GF_SECURITY_ADMIN_PASSWORD=<your_password_here> volumes: - ./grafana/data:/var/lib/grafana networks: - iotnetwork nodered: image: nodered/node-red:latest user: "1000" container_name: nodered restart: unless-stopped ports: - "1880:1880" volumes: - ./node-red/data:/data networks: - iotnetwork timescaledb: image: timescale/timescaledb:latest-pg13 user: "1000" container_name: timescaledb restart: unless-stopped ports: - 5432:5432 environment: - POSTGRES_PASSWORD=<your_password_here> volumes: - ./timescaledb/data:/var/lib/postgresql/data networks: - iotnetwork mosquitto: image: eclipse-mosquitto container_name: mosquitto user: "1000" restart: unless-stopped ports: - "1883:1883" volumes: - ./mosquitto/mosquitto.conf:/mosquitto/config/mosquitto.conf networks: - iotnetwork networks: iotnetwork: - Create folder for Mosquitto in iotdemo folder with “mkdir mosquitto”, create conf file in this folder with “sudo nano mosquitto.conf” and add below configurations:
listener 1883 allow_anonymous true - run “docker-compose up -d” command in iotdemo directory to create docker containers for Node-Red, Mosquitto MQTT Broker, TimescaleDB and Grafana.
- In case of need, you can restart the containers with “docker-compose restart” or stop all containers with “docker-compose down” commands.
Node-Red on Raspberry Pi
We’ll again use Node-Red as a business logic layer for our IoT Platform. We’ll only need one additional node outside of default palette to write data to our database. In order to install “node-red-contrib-postgresql”:
- Open the Node-Red editor by navigating to http://”raspberry_pi_ip_address”:1880 in your web browser.
- Click menu icon on top right and then “Manage palette”
- Under “Install” tab, search for “node-red-contrib-postgresql” and click install.
- “postgresql” node should be visible in the right panel.
Now we can start to build our flow in our IoT Platform:
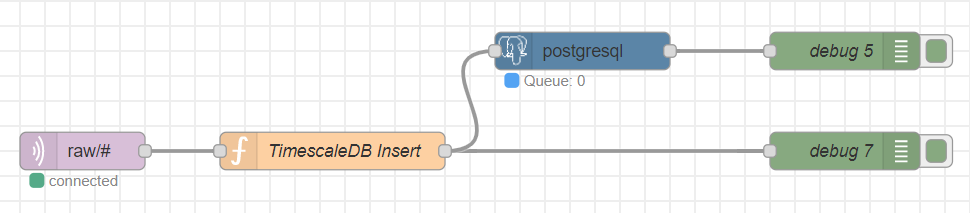
- Add “MQTT In” node to ingest data from Edge Gateway. Set server as http://”raspberry_pi_ip_address”:1883 and Topic as “raw/#”.
We’ll use generalized rules which can be applied for all raw data therefore we’ll be able to collect all raw data from single ingestion point.
- In order to utilize postgresql node, we need to prepare the message accordingly. Below code first parse the MQTT topic to identify site, area, device and sensor information. Then it will extract timestamps and sensor values from the payload to create arrays. Finally create list of parameters to be used by query and create query.
// Split the MQTT topic string into separate components var topicItems = msg.topic.split("/"); var site = topicItems[1]; var area = topicItems[2]; var device = topicItems[3]; var sensor = topicItems[4]; // Extract timestamps and values from payload var values = []; var times = []; msg.payload.forEach(function (data) { times.push(data.time); values.push(data.measurement) }); // Define parameters msg.params = [times, site, area, device, sensor, values]; // Generate query msg.query = "INSERT INTO iotraw (time, site, area, device, sensor, measurement) SELECT unnest($1::timestamp[]), $2, $3, $4, $5, unnest($6::double precision[])"; return msg; - Finally we can add “postgresql” node after function node and under Connection tab: Host: http://”raspberry_pi_ip_address” Port: 5432 Database: iotraw SSL: false and then under Security tab: User: postgres Password: your_password_here
- Don’t forget to deploy flow by clicking “Deploy” button on top-right corner. Final flow should look like this:
TimescaleDB on Raspberry Pi
TimescaleDB is a time-series database that is optimized for storing and querying large volumes of time-series data. We’ve already created TimescaleDB instance with our docker-compose. Now we’ll create simple database and table in it:
- Connect TimescaleDB instance on Docker:
docker exec -it timescaledb psql -U postgres - Create a new database by running the following command:
CREATE DATABASE iotdemo; - Connect to the new database by running the following command:
\c iotraw; - Create a regular PostgreSQL table to store the sensor data by running the following command:
CREATE TABLE iotraw ( time TIMESTAMPTZ NOT NULL, site TEXT NOT NULL, area TEXT NOT NULL, device TEXT NOT NULL, sensor TEXT NOT NULL, measurement DOUBLE PRECISION NULL ); - Convert the regular table into a hypertable partitioned on the “time” column using the create_hypertable() function provided by Timescale:
SELECT create_hypertable('iotraw', 'time'); - Exit the PostgreSQL server by running the following command:
\qGrafana on Raspberry Pi
Grafana is a popular open-source tool for creating dashboards and visualizations for time-series data. To install and configure Grafana on the Raspberry Pi, follow these steps:
- Navigate to http://”raspberry_pi_ip_address”:3000 in your web browser to access the Grafana interface.
- Log in to Grafana using the username and password you configured in docker-compose.yml file
- Click on “Menu” icon and then under “Connetions”, click “Connect data”. Search for “PostgreSQL” and click on icon. Finally click “Create a PostgreSQL data source” button.
- Configure the PostgreSQL data source by entering the following information:
- Name: iotdemo
- Host: http://”raspberry_pi_ip_address”:5432
- Database: iotdemo
- User: postgres
- Password: your_password_here
- TLS/SSL Mode: disable
- Click on the “Save & Test” button to test the connection to the TimescaleDB database.
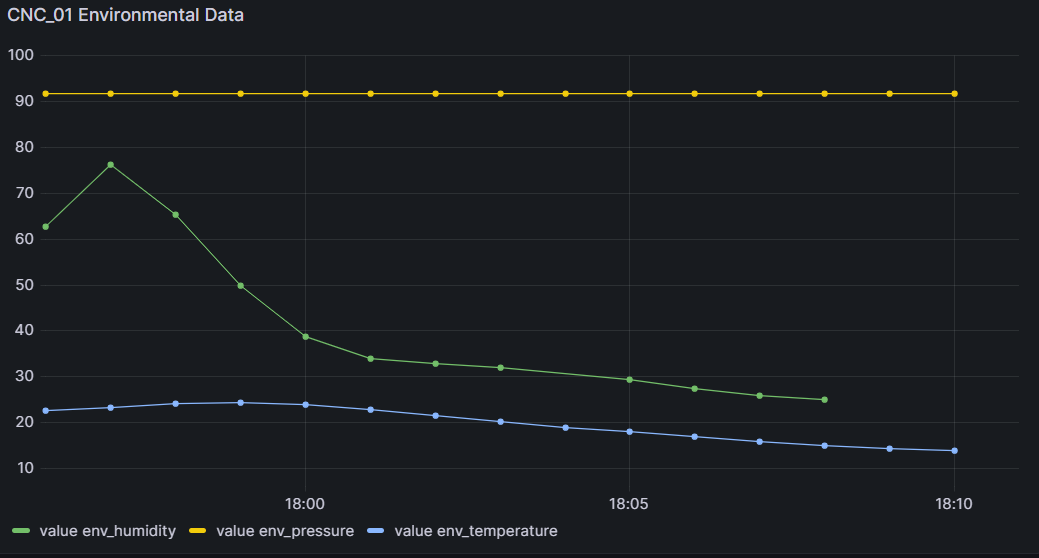
- Create a new dashboard by clicking on the “+” icon in the top-right corner of the screen and selecting “New dashboard”. Click again “+ Add visualization” button.
- Configure the graph by selecting the “iotdemo” data source, selecting the “iotraw” table, and configuring the query to retrieve the desired data. Query section has “builder” and “code” option. Choose “code” and paste below query to the editor.
SELECT time_bucket_gapfill('1 minute', "time") AS "time", AVG(measurement) AS "value", sensor FROM iotraw WHERE time >= $__timeFrom()::timestamptz AND time < $__timeTo()::timestamptz GROUP BY time_bucket_gapfill('1 minute', "time"), sensor ORDER BY time ASC - Save the dashboard by clicking on the “Save” button in the top-right corner of the screen.
- Now we should see the dashbard panel as below:
Congratulations! You have now built an industrial IoT demo using the Bosch XDK, Siemens IoT2040, Raspberry Pi 4, and a variety of open-source software tools.
Since our demo was very small scale, we did not extensively consider the performance metrics of the chosen open-source solutions. Our primary focus was on selecting well-known and easy-to-implement components that allowed us to quickly kickstart our project.
Conclusion
As an avid supporter of open-source software in the industrial environment, I strongly emphasize the importance of its increasing usage. Utilizing these tools is a great way to foster creativity, adaptability, and cost-efficiency for digital manufacturing projects.
Our exploration into building an Industrial IoT solution using open-source technologies has only scratched the surface. Moving forward, we will continue to examine our existing architecture and identify potential bottleneck areas. Our aim is to optimize the system by replacing certain components with more suitable alternatives. As we go deeper into these subjects, stay tuned for my upcoming posts!